A pie chart is a circular chart divided into sectors, illustrating numerical data.The numerical data that was obtained through the questionnaires wasn't visually clear and so graphs were used to illustrate the results in a way that's easier to analyse. The findings are visual and so make it clear as to what the majority of the individuals view as most effective. This is because all the different choices are easily distinguishable due to the colours as well as layout.This provides a clear representation of the elements that can be used to suit the expectations of the target market.The results of the questionnaires are displayed in the pie-charts below. By using the charts, the identification of what is found to be most effective is simpler. This therefore enables the group to make decisions based upon the preferences of the audience and therefore target market. The suggestions provided by the audience were discussed within the group in order to develop what was already decided. By taking into consideration the views of those who participated in the questionnaire, the video is more likely to appeal to the audience by involving elements which they find appealing.

The questionnaire was distributed amongst a variety of people; both male and female. This avoids gender bias therefore the results can be generalised to the wider public. By involving both males and females, the results illustrate what is found to be effective amongst both genders therefore the music video that will be produced is more likely to appeal to a wide target audience.

The questionnaire was given out to individuals aged 14-40. A wide range of ages improves the accuracy of the results, therefore providing a reliable view of the audience and their preferences. The age which most most common is 17-19 due to having the opportunity to ask students since the questionnaire was conducted in a school environment.
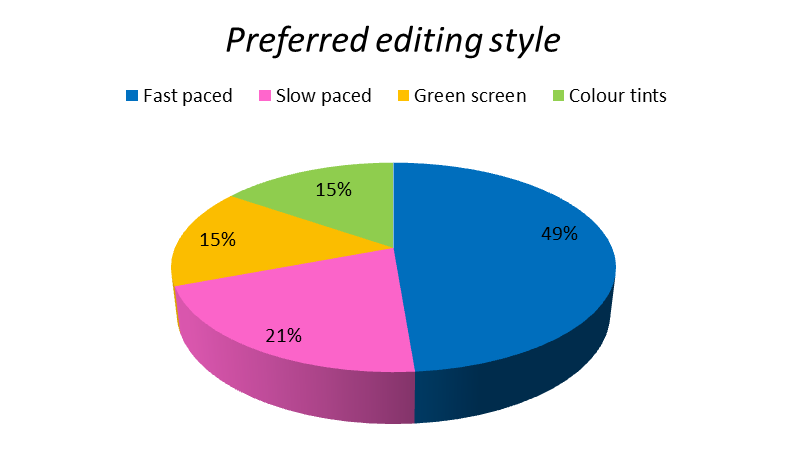
The preferred editing style of those who participated in the questionnaire is slow pace editing, fast paced editing being the second most common. The music video will therefore feature editing which varies in pace. Slow paced editing is effective in portraying the narrative aspect of the music video whilst faster paced editing will be used when the song increases in order to form a relationship between the music and visuals as mentioned in Goodwin's theory.

It is clearly visible that the majority of participants prefer a music video to feature a motif which is simply a reoccurring image or concept. In the music video, cards will act as the motif as they are able to infer varied connotations such as a game which can be linked to a relationship. The results of the questionnaire confirm that the use of a motif will be effective in regards to appealing to the target market.

The results show that the most common genre chosen was pop therefore this is the genre of the song which the music video will be produced for. The pop genre appeals to the majority of the individuals who participated in the questionnaire and therefore the music video will suit a mainstream audience. The pop genre involves conventions which are evident in many videos that have been analysed by members of the group. Our knowledge will therefore assist us in making a video which is conventional.

A video can either be conventional meaning it follows conventions and theories or diverse which refers to generic conventions being dismissed. The results of the questionnaire clearly display the majority of the sample prefer a music video to follow stereotypical conventions of a given genre. As the chosen genre i.e. pop is mainstream, a conventional video will be made as it allows the audience to relate to the narrative as opposed to lack understanding of the video is it was made to be diverse.

As illustrated by the pie chart, music videos are often watched and so have a wide audience depending on the genre. Most of the participants view 11-15 music videos per week which suggests they have an in-depth understanding of music videos and so have expectations of music videos which must be met.


Those who are aware of James Arthur were asked an open question which aims to find the single that is mostly preferred. The results show that 'Impossible' is the song which is favoured most and so it will be used within the music video.
This post demonstrates a good understanding of the results that you received from your questionnaires.
ReplyDeleteNow aim to explain how your research will assist you with planning your music video